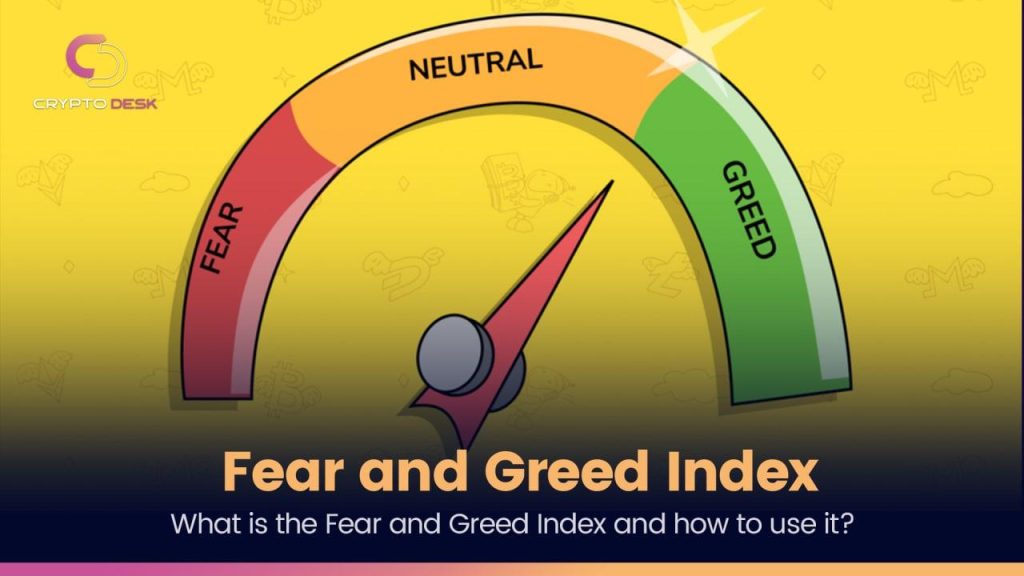
Any good trader will definitely know about technical and fundamental analysis and its impact on the crypto market. But what is The Index of Fear and Greed and what is the use of sentiment analysis in the crypto market?
Emotion analysis, which involves making decisions based on the emotions of other traders, is certainly very important, especially in the cryptocurrency market.
Each investor’s perspective on future market trends influences their decisions when trading. In the long run, it may be the value of the company that sets the prices, but in the short run, it is the market sentiment that drives the prices. This can create investment opportunities for long-term investors to find attractive entry points.
What Is Market Sentiment?
Market sentiment is a qualitative measure of investors’ attitudes and general feelings about financial markets or a particular segment of the market.
Since market sentiment cannot be accurately defined or measured, there is no one-size-fits-all unique way to analyze emotion. However, there are ways to estimate it, using a combination of some indicators that reflect market sentiment.
Emotion analysis tool: Fear and Greed Index
There are tools that, at a certain point in time, perform a simple analysis of general market sentiment. The Fear & Greed Index for instance collects market sentiment from a wide range of sources and charts it.
Emotions in the crypto market provide a more comprehensive set of emotion analysis tools. These tools include the Strategic Equilibrium Index and the Overconfidence Index, which indicate the risk of investors being in risky situations, based on Bitcoin price behavior.
Although all automated tools, robots, and indicators have been developed over the years, the markets are very irrational and overwhelmed by human emotions.
Many traders predicted a sharp jump in bitcoins and altcoins after the consensus and it does not matter if what happened three years ago was accidental or not.
That is to say, if enough investors expect something to happen this year as well, then it will happen.
What are the sources of fear and greed index?
The fear and greed index is currently calculated only based on bitcoin, But it can also be extended to altcoins. To calculate this index daily, there are six criteria to assess.
Social Networks with a 15% share
Talking more about cryptocurrencies on social media can be one of the reasons why investors are greedier.
Polls with a 15% share
In the past, 15% of the results of the fear and greed index were determined by polls. But now this option has been suspended and its share is divided among other factors.
Fluctuation with a 25% share
Excessive price fluctuations are a sign of fear in the market. This is why 25% of the weight is given to the price fluctuations in the last 30 and 90 days in calculating the index.
Trends with a 10% share
One of the tools that can be used to get information about the sources of the Internet is the Google Trends tool. This tool, as its name implies, is a product of Google. Google Trends provides users with extensive information about the keyword sources in the Google search engine. Of course, this information requires careful analysis and is one of the factors that affects The Index of Fear and Greed. For example, if the search for the phrase “bitcoin price decline analysis” shows a lot of growth, it is a clear sign of fear in the market.
Bitcoin Dominance with a 10% share
This indicator shows how much bitcoin dominates the market. For example, if the Bitcoin dominance index shows 60, it means that 60% of the total cryptocurrency market belongs to bitcoins. In the fear and greed index formula, bitcoin is assumed safer than altcoins. Thus, when its dominance rises, it is a sign of fear of traders. On the other hand, as bitcoin’s dominance decreases, people become more ambitious to invest in riskier cryptocurrencies.
Market volume with a 25% share
The volume of transactions in the crypto market is a sign of greater greed in individuals. This number is also included in the index as an average in the intervals of 30 and 90 days.
What do the numbers on the fear and greed index indicate?
In general, the numerical range of the chart and The Index of Fear and Greed is between 0 and 100 and has 5 situations, including:
– Extreme Fear: it refers to the range between 0 to 25 which indicates the presence of extreme fear in the market. Some technical analysts consider this situation suitable for entering the market.
– Fear: it is also used when the chart number is between 25 and 50 and indicates the existence of fear among investors.
– Neutral: it corresponds to the number 50 in the chart and indicates an equal level of fear and greed in the market.
– Greed: When the number chart shows between 50 and 75, it suggests the greed of investors for more profit.
– Extreme Greed: This is the latest status of the chart and is related to the range of 75 to 100, showing the intense greed of users. Technical analysts warn against entering the market at this time because, due to the greed of users and their influx into the market, prices have gone up too much and there is a possibility of falling at any moment.
Final point
The Index of Fear and Greed, or Emotion Analysis Chart, is one of the hundreds of other tools for better and less risky trading in financial markets, especially cryptocurrencies; But, like other tools, the fear and greed index must be used with the right strategy, and it is not possible to continue the path of success and make a profit with the help of this tool alone.
